Can Claude Build an Investment-Banking Grade 3-Statement Model in Excel

- 45:07
Debs and Graham asked Fable 5 for a five-year three-statement operating model on Lululemon.
Downloads
No associated resources to download.

Transcript
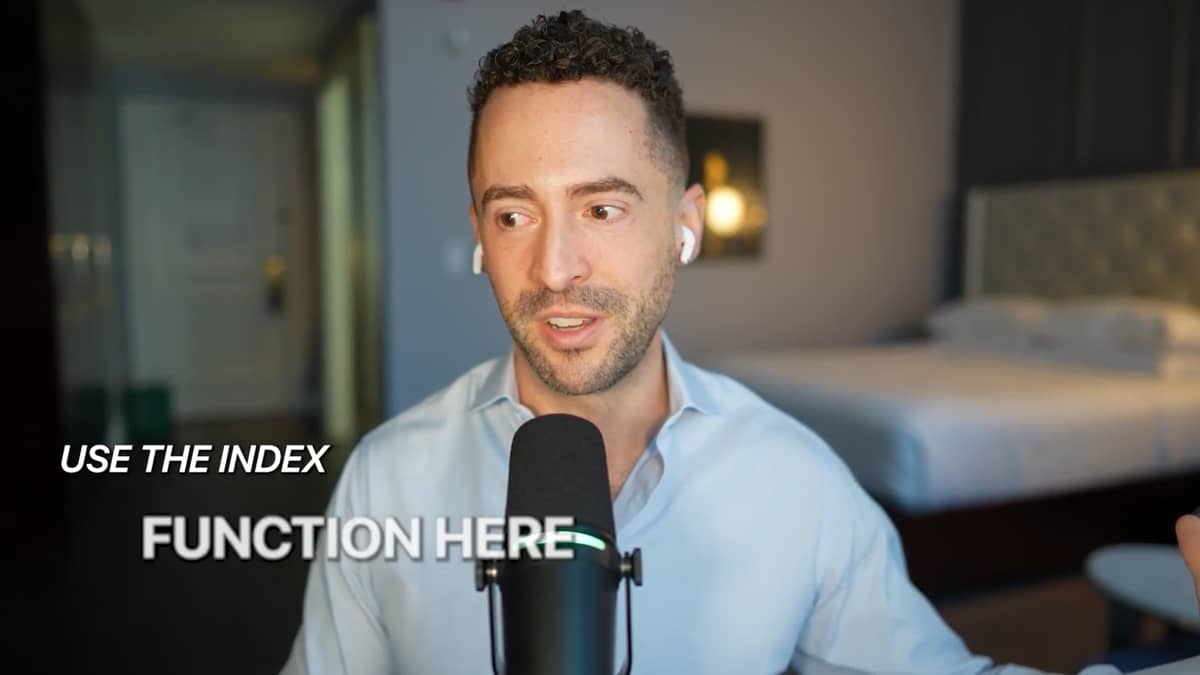
I didn't prompt Claude to use the index function here.
It just kind of picked up and did it on its own.
The CapEx is based on three scenarios.
The DNA is a fixed assumption. So as you're flexing your CapEx up, that presumably would result in a change in your DNA assumption.
I think this might be the best one we've seen so far, but I have taken more time with it, admittedly.
I would give this a B plus, which I think is my best grade so far.
Hello to all of our listeners. Welcome to this week's episode of "What's the Big Deal?" And Graham, what is the big deal for this week? So we wanted to continue on with our theme of investigating AI and model building.
And rather than a simple prompt where we just prompt Claude or GPT and see what we get, want to actually take some time and prompt correctly and see how we can use these tools really to our advantage as bankers and put together a pretty fully comprehensive three-statement model.
So today we're going to look at Lululemon.
Yeah, returning to our old favorite because we've used Lululemon for, I think it was for our DCF challenge, I think twice now we've used it, so we're starting to get a bit familiar- Yeah ... with the company.
Yeah, exactly. And again, I kind of like examples like this because it's a company everyone knows, so it's easy to understand.
But I actually don't know too much about the ins and outs of the company, so I'm kind of curious to see how Claude did as we go through this model today.
Absolutely. So you've actually already run the query in Claude, haven't you? Do you want to tell us a little bit about what you did, and also importantly, which model you were using? I have. So we are continuing on our Fable 5 journey because obviously this has been the one that's delivered us quite impressive results.
But unlike previous episodes where we've given a simple prompt and just said something literally as basic as build a DCF for Lululemon, I took quite a bit more time and prompted more fully, and I'm going to put the prompt. I'm not going to read through it right now just because it'd take a little bit too long to read, but we'll post the prompt in the comments if anyone's curious to take a look.
But I basically said, "Take a bit more time." I gave some instructions, where to pull the historic results from, some guidance on where to pull the forecast from, and then a few thoughts on structurally what I wanted to see here.
I made it clear I wanted a three-statement model.
I gave some, not too specific a guidance, but I gave some specific instructions around some of the features I wanted to see in this model.
Having a few different cases, some ability to adjust, say, working capital, which I think is important for a business like Lululemon.
Oh, also CapEx, because we were talking about, I think it was like they had a restructuring plan or opening new stores.
So I wanted Fable to do the research and pull together information about exactly what's happening in these areas.
But I gave it some specific pointers on things I wanted to go and look for.
Okay, fantastic. So you've requested a three-statement operating model, and just for clarity, that's the sort of model you'd build if you're working in company research, if you're on the buy side in research, or even if you're looking to build a transaction model that overlays the operating model, for example, in private equity or investment banking, if you'd like, advising on an M&A deal. So these are really fundamental, aren't they, for the banks in terms of building out an operating model.
And you're doing it on a five-year time horizon, is that right? I did on a five-year time horizon. I feel like that's the typical time period for something like this. And you're right, on its own, the three-statement model is not particularly interesting because it's just a set of forecasts.
Ultimately, it's what you do with these forecasts- Yeah ... that is the interesting part. But this is really the foundation, right? Yeah.
This could be turned into DCF. Most financial modeling, we're modeling cash flows to some extent.
So if, say, we were looking at Lululemon to buy on an LBO, this is how we'd forecast cash flows to pay down our debt.
So this is really the fundamental model that you really need to get right before you move on to anything else.
Absolutely. And it is an interesting case study, as you say.
They've had a really challenging time recently.
They've had proxy fight, I know we've mentioned that in previous episodes.
They've been struggling slightly with their strategy.
Domestic sales have been really under pressure.
They were relying on China for growth, and now that's come under pressure as well. So there's lots to factor into their operating model.
But let's dive in, shall we, and take a look at what we've got.
So we're on the cover tab. So what have we got here then, Graham? So let's see. We've got our, kind of like you'd see on any well-compiled model, we've got our checks, in essence, to make sure everything's all right.
We've also got a couple input cases, or input cells rather, to change our active scenarios. So we've got our bull case, base case, bear case. And by the way, in addition to just a simple kind of upside base, downside case, it's actually a bit of thought that's gone into figuring out what assumptions sit behind these cases.
And actually, I think this is something we could spend a lot of time talking about, just the assumptions that go behind models.
I think if I'm honest, a lot of people these days are kind of guilty of just putting models together without thinking too much about the actual assumptions that sit behind them.
Because kind of like the DCF, in some ways, the three-statement model doesn't have that much in terms of assumptions that drives everything. Ultimately, almost all this model is really driven off of revenue growth.
And if you haven't taken your time to really understand and come to a view on what you think your growth assumptions are, everything can be pretty wildly off.
You might have a really perfectly compiled model, but in terms of making real-world sense- It might not actually do what you want it to.
So really taking a beat to think about assumptions is really, really important, almost in some ways more important than the actual model itself.
So here we've got three cases, and some of this has to do with different performance across geographies.
Because I think, Debs, we were talking just before we started this episode, there have been some issues for Lulu in terms of their China rollout. That's something that Fable picked up and has on the assumptions here. That's all been factored into the growth rate assumptions here. So actually a really interesting set of cases here. And then we've got our standard set of model checks. Does the balance sheet balance? We've also got a couple other checks that it's built in, just making sure historic revenue ties up to the actual 10-K, that kind of thing. A couple key outputs, color key.
I asked it to follow investment banking best practices.
So hard code's in blue, formula's in black, links in green.
And then a couple of just high-level notes.
So, nothing earth-shattering yet.
Yeah.
The most interesting thing to me here is the detail behind the revenue growth assumptions.
Far and away better than, I think, anything else we've looked at so far.
Yeah, because I know with the bull and bear case, the simple thing to do is just to add 100 basis points revenue growth, subtract 100 basis points.
But that's not actually modeling a scenario.
And what we- Exactly ... can see here is that, yeah, Claude has already said, okay, base case, that's based on consensus and management guidance.
The bull case is that we've got China accelerating growth and America's return to growth. The bear case is US consumer slowdown and market share loss to competitors, and I think that's a big concern for Lululemon at the moment.
That's a big feature of what was happening with the proxy fight was the market share losses. So interesting with model scenarios, and I think interesting to see how that manifests itself with the growth assumptions in terms of the spread of those assumptions.
Yeah, and obviously, we don't yet have detail in terms of what behind the scenes the model did to actually articulate those assumptions into the actual growth rates.
We'll see if we get a bit more detail here.
But just the note that we're... Or just the fact that we're actually taking the time to think about some of these, I think is really interesting.
So let's continue on and see what we got here.
So one thing I did here compared to previous exercises and previous episodes was, again, I really wanted to build something workable and usable rather than prompting to see what we got.
So one of the things that-- If anyone's ever used these tools for any kind of vibe coding before, you know that one of the things that's really important is having the model essentially include a persistent set of instructions for itself somewhere, so it knows what's going on.
Because the risk is, of course, even if I close Excel, reboot my computer, I would lose the context history in the chat I've got with Fable 5 here.
So if I wanted to pick this back up and add a new sensitivity case or change something around, I'd basically have to start from scratch.
So this README is basically a set of context notes for Claude to give to itself or to lift this out into another agent. Actually, one thing it'd be interesting to try is opening up a, say, ChatGPT interface and seeing how it could easily pick up this model. So the README is a full set of instructions for the agent itself.
That way, this file can be a living, working document that doesn't need a separate context history alongside of it.
So it's not actually anything to do with the actual model.
This README tab is everything to do with how the agent is going to interact with it. Now we get onto our assumptions.
So we've got our three sensitivity cases or our three revenue growth cases.
So interestingly, we've got revenue, it looks like, split out entirely by geography here. So it's not just a matter of taking, say, one blended growth rate.
We've actually gone through the effort of looking at revenue growth in Americas, China, and the rest of the world.
Now, Debs, you know Lulu a little bit better than me. Is this the right split? If you were going to model this, is this how you'd think about it? Yeah. When you're building a model, one of the first things you think about are what are the drivers in your revenue build.
And I know that Lulu does provide a segment disclosure on a product basis and a geographical basis.
And really, you can pick and choose whichever you think is going to be the key differentiator in terms of driving revenue growth.
And we know that Lululemon has had a very different battle on its hands domestically versus the rest of the world.
So splitting it by geography really makes sense, and it's lovely that you can see how its womenswear is doing compared to its menswear sales.
But realistically, that's not going to be the key differentiator in terms of revenues going forward, because we know there's competition at home in the Americas from lots of up-and-coming athleisure brands. They've been growing very rapidly and going through a store expansion in China. And then they're also expanding in the rest of the world as well.
So that's really where you want to focus your efforts in the revenue build, and so that's what Claude has already identified, which is great.
I think that's the most interesting thing for me so far, is that that's what Claude had identified.
And again, we're going to post this model, by the way, and on the last tab of this model, I inserted the full set of, in essence, decision points. So a short-form version of the entire chat history I had with the agent putting this together, where you can see where Claude identified something and asked a question. And one of the points in the model build process- Claude had identified.
Actually, it looks to me like the revenue split is more interesting than the segment split, so Debs, to your point, menswear, womenswear, that kind of thing. Is that the split we want to run with in terms of how we forecast? And that's what we've got here. So we've got a few different cases.
Now, I had a quick flip through this last night, and so I was going through the YouTube comments for one of our other videos, and I had made a comment around, "I don't really like the choose function that much," and someone asked, "What one do you prefer instead?" For a really simple case selection mechanic like this, I actually like index. And by the way, I didn't prompt Claude to use the index function here. It just kind of picked up and did it on its own.
And the simple reason for that is if anyone can see my screen or is following along on the YouTube video, as I just go through and hit F2 and Escape and just visually audit this model, the reason I like index for a selection like this is simply because you get the selection box over all the stuff that you're selecting.
The choose function, you get the individual selection boxes.
I think the issue with it is you have a lot of potentials for screw-ups if you haven't done the ordering correctly. The index function is just cleaner.
So you've got a lot of different options in Excel for how to do stuff, but if you've got a few things to choose from and they're all in one continuous region, this is just my preference anyway.
I don't know if you've got a favorite, Debs.
Yeah, index, likewise. The problem with the choose function is editing it.
If you want to add an extra case, you've actually got to go in and add keystrokes, whereas you can actually extend your array with the index function, and it means you can add a case really very quickly in a way that you can't with the choose function.
Yeah.
So yeah, absolutely. Index is kind of probably 90% of models that I pick up have the index function for scenarios.
Yeah. So you got offset as well. I also don't really like- Mm ... offset because say you're offsetting, I don't know, 10 rows from a cell. You hit F2, and you just see the starting point, and then you've got to try to count down 10 rows just in your mind, and it's just not clean. So index- Yeah ... index all the way if you can. Okay, so we've got revenue growth, we've got margin assumptions, we've got working capital days.
Again, I think this is an interesting lever to pull for a business like Lululemon, where obviously we've got retail stores and stock sitting on shelves.
And then a few different cases for CapEx.
Now, this is something that I did prompt Claude at least to think about, because Debs, we've been talking about different store opening and restructuring plans, so I thought actually having a few different CapEx cases here could be interesting. Let's see.
One-off restructuring initiatives and capital returns vis-à-vis share purchases. This I didn't say anything about. Again, if you go in the context history or in the chat history rather, these are things that Claude had identified just on its own and built into the model. So in terms of drivers here, Debs, is there anything else that you would want to see if you were doing this model just yourself from scratch? I think the only thing I'm surprised by is that there doesn't seem to be an explicit assumption for marketing, which is such a key part of their cost base. And in research, when we do our cost build, we usually tease out the big cost lines, and I can't see that here.
But hey, I haven't dug into it in detail.
Maybe suddenly that'll magically appear somewhere in our income statement.
But yeah, certainly that would be, for me, an expected key assumption.
Yeah. Here, obviously we've got gross margin, we've got SGNAs, percentage of revenue. So in terms of the kind of backup assumptions for what's gone into these, I don't know yet.
I'm also sure if we really wanted to refine this model, and we can try and see if we've got some time for it in this episode, we can see if Claude will go through and pull this together.
I think now that we've got the full context history in this model, it's going to be a lot easier for us to go and make those kind of refinements.
So, okay. So marketing expenses, maybe a question here, but otherwise, high level, I think we feel okay.
Yep, absolutely.
All right. Let's take a look at our income statement.
So three-statement model, we got income statement, balance sheet, and cash flow statement. We got our income statement broken down in terms of the three different revenue splits that we looked at on the previous page.
I'm just going to take a look at the comments that's inserted into these historic cells here. So one of the things I really love about how these tools pull historic data is they'll be really explicit about the reference point that they're using.
And I know anyone who's worked in finance for a while has used FactSet or CapIQ. You get the same thing if you drill down into financials on one of those platforms.
But here, I didn't have to do anything, right? I just prompted saying, "Hey, pull the historic results from the 10-Ks," and here we go. We've got everything laid out really neatly and tidily.
Let's see. Okay, if I'm being really critical, and again, I didn't prompt for this, so I guess I'm not expecting too much.
I'm seeing these hard-coded dates here.
I'm sure, Debs, you and I are both fans of having, say, one input date somewhere, counting up months or years from that, and having formatting applied, so all these titles look okay, but are driven dynamically instead of hard-coded. So that's something I would probably go back and re-prompt to fix.
But again, that's just a detail point rather than fundamental modeling issues here.
So we have this section down at the bottom on normalization adjustments, and because Debs, I know we had been talking about some restructuring initiatives, this is something that I did prompt Claude to add if it was worthwhile.
So we've got, again, as I would expect, most of these normalization adjustments are in the historic period. It's not like we're forecasting anything explicitly.
I don't know if that's the right assumption or not.
I don't know if we've got some kind of restructuring initiative that has been started but hasn't been completed that we might want to break out separately and show here. And in any event, it looks like these adjustments are not that significant in the context of the overall size of the business here.
We've got in 2025, reported EBIT of 2.2 billion and then 20 million of proxy contest costs. It's not nothing, but it's also not insanely material in the context of the numbers we're talking about here. So I don't know.
Anything else you would want to see in this schedule, Debs? No, but I think it's important that even if things are going to be kind of zero in the near future, it's quite useful to have placeholder lines in your forecasts, so that if you have to update your model post-results, that you've got that ready and waiting. So including zero forecast for the adjustments is actually quite useful.
It also means you- Yeah ... can reconcile the historical numbers to what's actually being reported, and that's particularly important when you're looking at things like building valuation on top of it. Things like multiples usually use a normalize, a clean earnings figure, either on a trailing or a forward basis. So the ability to get to that number while still then be able to see how it links to the actual reported numbers in the financials is really important.
So yeah, this looks very sensible to me.
The proxy contest cost, that's really interesting because that is a reflection of what's been going on in the business.
I know that as part of the challenge, there were legal costs incurred, and Chip Wilson asked for those costs to be covered, and then there was a donation made to, I think, a charity of the costs- ... that he'd incurred.
So it's really interesting to see that come through in the model actually.
It sounds really above board.
Yeah. Oh, yeah.
Absolutely.
And, by the way, what was just for everyone's benefit, for my benefit, what's the background on the proxy contest, just in 20 seconds? Okay. So Chip Wilson was criticizing the strategy of Lululemon, saying it lost its way, that it was no longer considered the premium brand, and there- And he's the founder? He was the founder and was previously- Yeah. Okay ... on the board as well, and he had challenged them and said that he wanted to change some of the board members.
And so he wanted to recommend some additional board members, and the board rejected that. And then eventually they settled, I think just at the end of May.
He was allowed to select two board members, in exchange for his silence for 18 months, for not criticizing the company publicly.
So there was kind of an agreement reached.
Okay.
And it's also worth bearing in mind, he does have a material stake in the business.
I think it's just under 10% stake in the business.
Okay.
So he still has a big influence on the business. But yeah, it was a big distraction, that, for management. And so they've got, yeah, two new members on the board, and they've got a new CEO on the way. So we'll see how that translates into a new strategy maybe going forward.
And then, so the proxy costs that we're adding back to get our adjusted EBIT here, these presumably are the proxy costs from Lululemon's side, kind of fighting the proxy battle.
And then what was the deal with his charitable donation here? Was that outside of this whole arena, just on his own costs individually? Yeah. So I think basically as part of the settlement, he'd requested for his costs to be covered by Lululemon, and they had refused to do that.
But then they settled- Got it. Okay ... on the equivalent value being donated to another cause.
Oh.
So, yeah.
I see. Okay.
Okay.
Got it.
But just a quirk.
Got it.
I love that but- At first, I thought it was a bit more sinister than that, and that he didn't get his costs recovered, and then someone donated to a charity of his or something like that. Oh, I see. No, nothing that dark. Oh, okay. So it's not quite that bad. Okay. Got it.
No.
All right. So income statement in general, at this point, I think we feel good enough about...
By the way, Debs, you and I teach a lot of financial statement modeling.
In terms of three-statement model, there's not a whole lot of real complexity here.
Right? It's put your income statement together, make some balance sheet forecasts, and then use the balance sheet and the income statement to reconcile the cash flow. There's a lot of mechanical things moving around, but it's not rocket science. So, so far this income statement looks okay.
There's one thing I've picked up on just while we've been looking at it, and I'm interested to see- Hmm ... as we look to the balance sheet, whether it resolves itself.
The CapEx is based on three scenarios.
The DNA is a fixed assumption. So as you're flexing your CapEx up, that presumably would result in a change in your DNA assumption because it's linked to revenue, the DNA assumption.
So I just feel that the only complexity here is that we've got these scenarios that maybe don't trickle through the income statement in the way you'd expect.
And that's in your EBITDAR- Potentially ... calculation.
Potentially. I'm just looking for where DNA is going into this income statement, because I don't know yet how it's calculated the depreciation. If we're just saying, say, it's a constant percentage of revenue, or if we've got a full CapEx and depreciation schedule that is dynamically updating itself based on whatever CapEx case we have included. So- Yeah ... let's take a look at that as we get to that portion of the model. It's looking to me, by the way, on here, and this is consistent with some of the ways we teach this content, by the way, is that DNA is just baked into both the COGS and the SG&A margin here. I don't see- Yeah ... a separate line for DNA that's being calculated dynamically based on our CapEx case. Again, I think that's something if we really wanted to spend some time and tinker with, we could build in some more complexity there.
Absolutely. I think it just feeds into the EBITDA number, which is a key metric that you would watch as an analyst, and that becomes even more important when you're doing evaluation multiples.
So I think it just affects the EBITDA.
So not too worried, but definitely kind of a slight concern there.
When you say it just affects the EBITDA, I'm just thinking- Yeah, so in row 22, your EBITDA presumably adds back the D&A assumption from the schedules.
Oh, yeah. Let's see. It's F20, so it's EBIT plus schedules F9.
Oh, and of course, yep. I don't know about you, I rely pretty heavily on some of the finance Excel add-ins to do formula auditing.
And every once in a while, mine just decides to break, and I got to reboot my computer to get it back. So I was trying to go through and audit, do one of the smart formula trackers and get back to schedules F9. But I'm just gonna, let's see, do it the old lazy way, and yeah, you're right, F9. F9 is the D&A.
So yeah, we're dynamically updating our EBITDA based on whatever CapEx and depreciation is being run through this model.
Okay. Balance sheet. Let's take a quick look through this and kind of see how we're forecasting each one of these different accounts. So we've got, if I look at accounts receivable, of course, we've got the specific receivable days assumption on our inputs. So we're using that to drive our balance sheet here. Let's see, something like prepaid expenses. It looks to me like, this is one where it might be helpful to have these growth assumptions just say on this exact tab, just for good modeling hygiene, because it's looking to me here like we're probably using a revenue growth rate, but it's not the easiest to audit just on this one tab here. So that's something- Absolutely ... I'd probably go back and change that assumption a little bit.
But I'm kind of eyeballing right here, to be honest, as I would if, say, someone just sent me a first draft of this model and wanted to take a look through. Right? Nothing thus far looks insanely out of whack.
Obviously, we're growing this business.
All these balance sheet accounts are growing a little bit.
We haven't specified any real changes in, say, the working capital profile.
So yeah, just looking through really quickly and spot-checking looks okay to me. What I want to go through, if we had a solid, say, hour, hour and a half to properly audit this model, I'd be going through, and I'd be checking every single line here to see how these forecasts are being made.
I would also go back and re-prompt to have the actual growth rates, even if they're, say, linked back to another tab, just if an account is being driven off of revenue growth, just, say, have the revenue growth assumption here, just so it's really easy to see. And as we're going through, I'm kind of thinking about next time I go and prompt a tool like this to produce a three-statement model, just kind of knowing what I'm going to prompt and kind of include in that setup, just so we get something that's immediately really, really usable. All right, so this looks right.
Do I have a couple things I'd change? 100%.
Am I stressed about it at this point? Not really. And how about you, Debs? Yeah, no, absolutely. As you say, useful to have explicit assumptions, particularly for anything that's remotely material.
Remember that every movement in the balance sheet has the possibility of driving a cash flow in the cash flow statement.
Yeah.
So, if it's a material balance sheet item, I would want an actual explicit assumption and, as you say, not just a kind of flaky ratio that's based on historical numbers extrapolated forward.
So yeah. But I like the fact that it's really clearly laid out.
I can see all the green links that will take you through to the schedules.
You'll know there's a supporting calculation for each of those green cells. So it does make it nice and easy to audit, I think.
Yeah. And we've got some-- I'm just going through and auditing and looking at the comments that Claude's inserted here.
We're saying, for a lot of these, constant percentage of revenue.
So it's not going to take me long to actually go through and figure out how it's been put together.
Yeah.
I've seen worse, that's for sure.
Yeah. It does make me smile that every little comment in the workbook, it attributes to you. And I think this is a key learning point when I'm teaching with Claude, is it does assume that these judgments become your own. And I know that I've certainly been through and changed the comment so that it says, "This is an automated assumption" or whatever.
Yeah.
But in reality, it's worth checking all of those comments, making sure that you are comfortable with the judgments made on your behalf.
It is 100%. And also, if that presentation is important to you, that's something I would include in my setup prompt as well, just to say anytime you're inserting a comment, change the name on the comment to you or something else, just so that we know.
But if I just insert a new comment, pick a random cell here, then it is, of course, the Excel default setup to have the user's name in that comment. Mm-hmm.
So I can see why it happened, but it's also easy to change. Cash flows? Yes. This is where it matters.
Cash flows, this is arguably the hardest part of the three-statement model is the statement of cash flows, right? It's the place where you've got the biggest potential to screw up.
You've got to know the relationship between increases in assets and increases in liabilities and how that flows through the cash flow statement, and this is generally where the highest propensity for errors is really the case.
So we've got three years of historic. We've got our projection period here.
So we're linking-- Okay, this Just visually, this sort of makes sense to me so far.
We're linking in green to things like net income, DNA, SBC, stock-based comp. These aren't calculations from comparing two different balance sheet periods together. And then I get down to the actual balance sheet section here, and for each one of these balance sheet accounts, I've got the formula to show me how Claude has thought about this here. There's nothing technically incorrect about this.
My preference, at least as it relates to looking at, say, assets on a cash flow statement, is to take last year less this year, so that if we've got an increase, it presents as a negative number.
It's not incorrect to have this negative this year less last year formula. It's technically fine.
Again, this is just a detail point for me.
The one thing I might go back and change is I actually find it's useful to have all these three statements just on one tab instead of split out into separate tabs, just because it makes the auditing process a lot easier.
I can audit this, right? But it would be a lot easier for me to audit if I had my plugin properly installed and working, right? I'm just jumping back to the previous tab here. So I can go through, but I'm a big fan of just hitting F2 and Escape all the time, and just if I can see on the same page where something is coming from, it makes the auditing process a lot easier.
I was going to say, I've got a comment- No, go ahead ... on the cash flows and operations.
I think Claude has made an implicit assumption as to how that it's built its forecasts relative to its historics.
There are some items where a movement in the balance sheet has a non-cash item in the income statement, as well as a cash flow associated with it.
And a really good example of that is their unredeemed gift card liability, which is effectively deferred revenue. So when you're working to the cash flow- Yeah ... you could basically say, well, the change in the balance sheet includes any revenue on that deferred revenue that's been recognized, as well as the actual cash flows received.
Now, historically, Lululemon has included the adjustment for the non-cash item in row 11 and the movement in the liability in row 22. Whereas it looks to me like Claude has put the entire number through row 22, which is why you get a bit of a weird trend between the historics and the forecast numbers. It has made that judgment, and it has had to- Yeah ... because there isn't a schedule for deferred revenue in the model.
But it's interesting that it's done that.
For me as an analyst, if I thought that was a really material item, I would be building a schedule for it, and that gives me a better- Yeah ... line of sight between the historics and the forecast.
But that's quite a techie point, and I will forgive Claude for that.
That's a really important point, and it's something that makes sense in the context of Lululemon.
Obviously, it's a big retailer. I'm sure people have gotten a Lululemon gift card for their birthday before or something like that.
So I can see this being a big driver for them. And again, this is something where I think if we went back and wanted to add some fidelity and detail, we could re-prompt and get this actual- Yeah ... schedule built the way we want it to.
All right. But again, I'm not going to spend too much time really auditing and going through this. We've got the check row at the bottom. Does our ending cash here equal our ending cash on the balance sheet? Does that all tie through so far? So far, it's looking good. I'm not seeing any crazy kind of one-offs yet. Again, I want to spend a bit of time auditing, going through, but it doesn't look nuts. We've got a couple of one-off cash flow items. These other financing, FX on cash in historic years, we're not running through in the forecast period, which unless we have specific information, is probably the right way to handle something like this, just because these items, one, aren't insanely material, and two, are inherently tricky to forecast.
Absolutely. The only time I really try to do anything like that is if you've got a business that's operating in emerging markets or something, and that's definitely not something that I worry about for Lululemon.
Yeah.
So yeah. All good.
Yeah, exactly.
And I think for me, I'm always nervous with Claude, with AI in general, that it's kind of put a plug in to try and make sure it sort of reverse engineers a cash flow which works.
But I had a good look through it, and it looks like it has got what I'd refer to as integrity, as in it fully links the balance sheet- Yeah ... the income statement, and the cash flow statement. So that's good.
Yeah, and actually, one thing that I'm just thinking out loud that I might add to a future prompt, and it's not necessarily something that we build in a normal three-statement model anyway, but if there's any way to build in some kind of live reconciliation between the balance sheet and the cash flow, just to make sure that in some way, shape, or form, every single balance sheet account is reflected on the cash flow statement, it makes the model a little bit easier to- Yeah ... to go through and validate and check.
I say in some way, shape, or form because they're not all the same, right? We've got things that are pretty basic like, say, accounts receivable.
We're looking at the difference between that account one period versus the next.
But then you've got things like CapEx, where you actually have to break down between the CapEx and the depreciation, and it's not quite as simple. But adding in some kind of auditing logic here might be interesting. So that's something I'm going to take away and think about for a future episode here. Okay. Schedules.
We've got, let's see, PP&E roll forward.
Okay, operating leases. Interesting. Operating leases scaled with revenue.
Mm-hmm.
Again, this is going to be a... I don't know that much about Lululemon, but I know enough to know that they're going to have a bunch of leases. So the fact that we're thinking about this separately here, I think is interesting.
Stockholders' equity roll forward.
Of course, we are forecasting Some share buybacks here. That was one of the things that Claude picked up to say, "Hey, just to be intellectually honest about earnings per share, we know that they have been making share buybacks. Do we want to continue those, at least to the extent they've been announced already?" So we're including that into our shareholders' equity roll forward, and then obviously into our diluted share count. Again, without going through these schedules in detail, anything else you'd want to see on here, Debs? No, I think it all actually looks quite sophisticated.
The fact that they've modeled out operating leases, so you could keep a check on things like return on invested capital through your forecasts, I think that's great. It's important to remember if a company's growing its store base, it could either buy them through CapEx or it could be signing new leases.
Yeah.
And that signing new leases basically is them increasing the capital invested in their business.
And if you can model that, more rigor to your model then. Yeah, and the share buybacks, that's again, quite a techie thing to do, modeling the share buybacks, because you need to make a prediction of things like the price at which they're going to be executed at, because, as you say, that then affects your share count. But if you don't do that, you end up with distortion to your EPS forecasts.
So- Yeah ... the fact that this has been done, I think looks good to me.
I'm very happy with that.
Sounds good. Last but not least is sensitivities.
Now, this is one thing that I've had a gripe about before. We've gone through these Debs and we've seen those kind of crazy formulas that are impossible to audit.
Yeah.
If you go through the chat history, and you go through the kind of questions on the last page, you should see that at some point, Claude asked if I wanted to have some sensitivities included, and it proposed these sensitivities around China revenue growth, gross margin, or China revenue growth, America's revenue growth.
And I said, "Yes, produce them, but can you produce these in just normal financial modeling best practice and use Excel data tables rather than complicated formulas?" And it highlighted a restriction of the Excel API and says, "Actually, the Excel API doesn't let me do this." Oh.
So what it did was it set up the sensitivity cases in the data table format that we'd expect to see, and then actually if you look in rows 11 and 20 here, it gives specific instructions for the user on how to set that up, literally how to create a data table and what to link to where. So it gives me a little bit more background anyway on why we've seen some of the stuff we have historically. So I'm sure in a future version of the Excel API, that Claude or whoever else would be able to create a data table. But if you don't know how to create a data table yourself, you should.
So- Yeah, absolutely ... the fact that I'd have to do this manually is not that big of a deal.
Although I would think that data tables, they sound on the surface, quite simple, but it's actually highlighted there in red font which cells you need to provide as inputs.
And I think that is a big source of confusion for analysts when they're building data tables. Because you're basically sensitizing- Yeah ... all the cells in the row. That's basically your, is that your margin expansion over contraction over the forecasts, and then your China growth in the column. And knowing which is which- Yeah ... when you're creating your data table, I think can cause a lot of confusion and give you some really weird outputs.
So the fact- Yeah. You know- ... that it's given you those instructions is great.
Yeah. So I remember when I was an analyst first starting off, I used to mess up... But the thing we're talking about here, by the way, is if you just go to this data table input row, row and cell input, I always used to... I mean, the way my brain works is that- Yes ... I'm just going to show with the mouse here, that these are the column inputs because they're in columns, and these are the row inputs because they're in separate rows, but it's the other way around.
Exactly. Exactly that.
The titling- My brain works the same way ... the titling is just dumb.
Yeah. I know. And it's weird because actually even it says table one, China growth is in rows, gross margin is in columns, in row 10.
I know. Yeah. I know. And so even Claude thinks like we do, so hey, we're as smart as Claude.
But it's so funny that you say that.
I honestly think- When I'm teaching it, people always get confused.
They're like, "Why is it like that?" I know. I honestly think it would be easier to just change the titles from rows and columns to vertical and horizontal or something- Yeah ... that's a little bit clearer. So anyway, that's a long-term gripe of mine, but I don't think that's going to change anytime soon because we've both been using Excel for 20 something years now.
Yeah.
And it's still the same.
But it does give a little bit more context as to why we see some of the stuff we have historically, just because Claude physically cannot use the Excel API to create the data table.
But I'm not mad about the setup that it gave here.
It gave explicit instructions to the user.
It provided the inputs on the same tab here.
Obviously, the data table need to have the inputs on the same tab you're working on. So you know what? Overall, I can't say I'm too mad about it. So obviously there's a lot more that we could go through here, and I mean, for anyone who's interested, obviously we're going to post this file online so you can go through the full conversation log here. These are all those decision points that I had with Claude as I was prompting. We could spend a lot more time going through here.
We have some refinements we could make with a bit more prompting.
But like we always do, Debs, what kind of grade do we want to give Fable here on this one? From my perspective, I think this might be the best one we've seen so far, but I have taken more time with it, admittedly.
Yeah. Yeah. I think- So I'm going to take some credit for that.
So I would say it's definitely more sophisticated, and I think it's worth pointing out that your original prompt, it's just four lines there.
It wasn't a very detailed prompt. It was definitely more detailed than we've done before, but it's still quite simple.
The prompts, if we're looking at the prompts In Excel here, it's a little bit more condensed than the actual prompt.
Okay.
The actual prompt is a couple of short paragraphs.
Yeah. Okay.
It took me just a few minutes to put together. It wasn't crazy.
Okay. But it's summarized there. It doesn't show that you're giving lines and lines of instructions.
So I think- No ... given that- No ...
accepting the issue with depreciation amortization, which I think is a flaw, and I don't mind too much the cash flow statement issues around movements in the balance sheet versus historicals.
But I would definitely want to improve that with the next iteration.
I would say I would give this a B+, which I think is my best grade so far, I think, for a model. How about you, Graham? You're pretty harsh on these models, I got to say.
I was exacting as a manager, yeah.
What about you, Graham? I think if I'm grading this real world in that if, say, an analyst or associate sent this to me and said, "Take a look, let me know what you think," I'd probably be in the same category.
I think B+ feels right here.
For me, it's the real Excel modeling best practices, just some of the traceability, auditability, having one, say, date input to flow through the whole thing.
Again, I'm pretty confident that we could get there.
And these are things that I'm going to add to my own mental prompt library as I go through and build one of these next time.
And one thing I'm just going to set myself the goal of creating a prompt that is going to get a version of this model in at least A minus, say, A state, basically first time around without any re-prompting.
And once I get there, then we should share that prompt on the video that actually gets there so everyone's got it to use.
Yeah.
Good stuff. So we've got a goal for the future, a grade from the past.
But I think that brings us to the end of this week's episode.
I hope everyone enjoyed our challenge that we set for Claude this week, and I think it was a very successful challenge.
I hope you've learnt a little bit about three-state modeling as well.
And that's it from myself for this week, and over to Graham.
And if you want to see anything else, let us know in the comments.
We do read them.
Debs and I are both crazy busy right now delivering live trainings in the classroom. I'm about to finish getting ready and go head off and do that myself. So know that if we don't respond immediately, we are reading them.
And if there's anything you want to see in a future video, just let us know down below. But until then, we'll see everyone next week