Three Variable Data Tables - Felix Live
- 24:25
A Felix Live webinar on Three Variable Data Tables.
Transcript
Great to have you guys in the room.
So we've got something really focused today.
We're gonna look at sensitivity data tables. We've got 30 minutes, but specifically we're gonna think about if you want more than two inputs.
How do we deal with that? And it's quite a fun kind of focused little topic.
Okay, I think we probably better get going really, hadn't we? So I'm gonna jump into the file now. There are quite a few different exercises in this file, but our session is focused on three input data tables.
So I just use my stylists and do your draw to your attention there.
The sheet we're looking at, so you've got welcome info, simple data tables.
You've got advanced data tables, and then you've got three input left, right? So if you could click on the three input left, right? Or if you want a keyboard shortcut, hold down, control and tap page, page down, 1, 2, 3, 4 times.
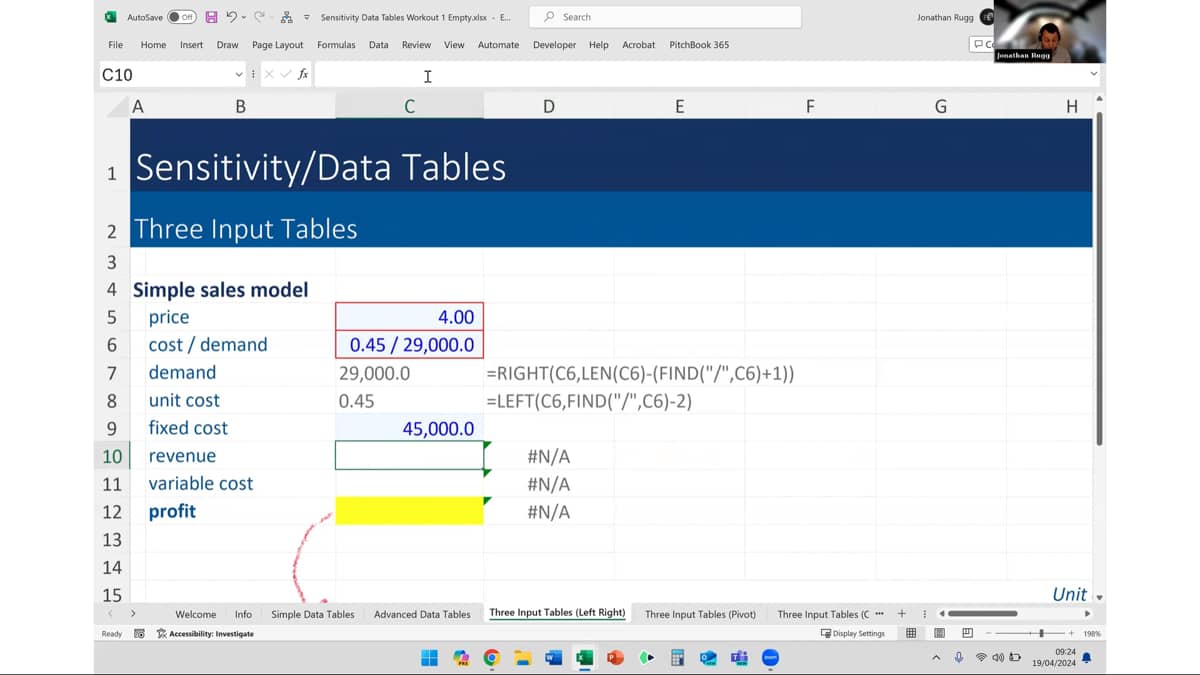
Okay? So we're gonna look at this sheet, right? Um, what have we got? Well, we've got this model that we're gonna build, and it's really simple.
We're gonna come down to think about profit.
So let's just highlight that.
I'm gonna highlight that in in yellow.
So profit is what we're gonna calculate in the model, and profit is gonna be the, the output, the subject, the output for our data table.
So I'm gonna go to the very top left of the data table, and I'm also gonna highlight that in yellow.
You don't need to highlight it in yellow, but I just wanna draw your eye to it.
So whenever we calculate in profit, it's gonna be the kind of subject of our data table.
When we produce our data table, it's gonna kind of squirt the profit numbers across the whole table for all different outcomes.
That's the kind of intention.
So each of these individual cells, you know, across, I'm not gonna annotate all of them, but you get the idea.
Each of these cells is gonna show, ultimately gonna show the profit.
So if I wanted to calculate the profit, that's gonna be tough at the moment.
So, we could say, well look what is the, to get the profit? I need to know what the revenues that we're gonna generate.
So in order to figure out the revenue, I need two things equals I need the sales price and I need to multiply that by the demand.
But I don't actually know what the demand is at the moment because if you look at the sell above, if you look in sell C6, C6 is cost and demand kind of all like crushed together.
And that's, it's got a space, a couple of spaces in there, and it's clearly a text string.
So if you try to calculate the revenue by taking the price and multiply it by that, so that's not gonna work.
Okay? So what I need to do is find a way in Excel to extract the demand out of that cell and also need a way to extract cost outta that cell as well.
So before we mess around with that, let's keep looking at the big picture in my data table.
We also are gonna try and sensitize for at least two things.
So typically it works in two dimensions, right? So we're gonna say, Hey, in yellow, what is the profit? And if you look at the column here, we're gonna sensitize the profit for changes in price.
I also would like to sensitize profit for changes in unit cost and demand.
And um, you should say you should sort of say naturally we can't do that, right? Because you've got just like a a column and you've got a row, and so you can just sensitize on a couple of things.
But actually that's what we're gonna try and achieve.
So, we're gonna do a little bit of hard coding.
If you guys do this with me, it'd be great.
So if you look at cell C, if you look at cell D16, E16, F16, et cetera.
So if you look at these cells here, I'm just gonna hard code in the middle, I'm gonna hard code this, this number.
So where it says 0.45, space slash space, 29,000 comma, separated with a 0.
So if you type in exactly what I'm typing in, 0.45, space slash space 29,000.0 okay, so 45 cents, 29,000. What I'm only gonna say is if we looked at this, so here I'm gonna say, hey, what if the price was $4? And what if the unit cost was 45 cents and the demand was 29,000? Then what would the profit be? Now I'm just gonna populate the rest of the columns, so I'm gonna decrease the price as we go to the right and I'm gonna increase the price as we go to the left.
So if we go, if I say copy and paste, I'm gonna kind of paste this across these headings and then I'm just gonna modify these headings.
So can you see in column G in G16 it says 45 cents.
What I'd like to do is change that to 40 cents and to the further right? Again, it says 45 cents, but I'm gonna change that to 35 cents.
I'm gonna go to the left of that kind of midpoint.
It says 49 cents and 29,000 gonna press F2.
And I'm gonna change that from 45 cents to 50 cents.
And I think you get the idea, we go to the left, most sell, I'm gonna press F2, I'm gonna change it from 45 cents to 55 cents.
Okay? So what we've got now across the top is we've got demand of 29,000 for every possible scenario, we've got demand of 29,000.
But I do have, different unit cost numbers, 55 cents, 50 cents, 45 cents.
Why did I put 55 cents in the far left? Well, that's gonna punish the property, right? The profit right? So if you've got a high unit cost, you're gonna get a lower profit.
And equally, if you look at the column of prices here, I've got the lowest price at the very top.
That means the top left sale is gonna have the highest cost and the lowest price.
It's gonna be the worst possible scenario.
Equally, if you looked at the bottom right, you've got the lowest cost of 35 cents and you've got the highest price. So that would be the best possible scenario, okay? What I'm gonna do is I wanna copy all of that, but I wanna have it for not, maybe not 29,000, but demand of 30,000.
And you could just keep replicating that, right? So you could have demand of 31,000, 32,000, 33,000 really as far as you wanted to go with that.
So if I copy those headings, so control C to copy those headings and control V to paste them in.
So now on the kind of right hand side, we've got exactly the same headings, but I want to change the demand from 29 to 30,000.
Gonna use a keyboard shortcut, which is control CTRL, and H, which is find and replace.
So if I select those headings and I hold down control and press h, which is find and replace, actually I pre-populated it already, but it says fine, well find 29,000.
So just take note that I've got, find 29 comma thousand and replace it with 30 comma thousand.
In fact, you could probably just knock those thousands out, right? So you could say replace wherever you find 29 in that selection, grab that and replacing that with 30.
So we can just have a sort of closer look at that, magnify that, okay, let's click replace all and just check out these headings.
Replace all really simple.
Hey Jonathan, you made five replacements.
Okay, close that down.
So now I've got a bunch of headings with 55 cents, 50 cents, et cetera, at 29,000.
I've got the same headings, but at 30,000 and we're all good.
Now we actually need to do some work because we, we need the hard bit now, so I, I wanna make sense of the, uh, cost demand sell.
What I'd like to do is I'd like to rip out the 29,000 from what is really a text string at the moment.
I'm gonna do a bit of formula work on that.
We've got about 20 minutes, so we've got enough time to break this down some steps and then we'll nest it all together at the end.
So let me show you some formulas as we go through I wonder if we might be able to just zoom in a little bit as well.
Okay? So I wanna extract that 29,000 and there's a few formulas I'm gonna use to do that.
And then I'll bring them all together at the very end.
And the first thing is I'm gonna say, Hey, Excel, you see this cell, it's got a slash in it, and that slash is a kind of separator, so I wanna, I'd quite like to find that slash and I'd like to kind of use that as a marker and maybe count everything after that.
I count the 29,000, so I'm gonna say I equals, I'm gonna use a function, and this is just a random cell I'm choosing, gonna use a function called find FIND.
Really simple. It tells you returns the starting position of one text string within another string, and it is actually good to know.
Okay? So let's press tab.
That'll complete the function for us, put the bracket in, but it'll also give us some prompts.
Give us the syntax.
So it says, Hey Jonathan, what text are you gonna find? Now I'm gonna look for a slash but that's not gonna work because I'll need to wrap it in double quotes.
So let's open double quotes slash close double quotes to say, I'm looking for this text string slash comma, and uh, Excel will say, great, Jonathan, you're looking for that, but where are you looking for it? So within what text? Well, if I, I can use my mouse to my keyboard, but I'll use my mouse so you can see what I'm doing.
If I click on that cell C6 I'm gonna look for the slash within that.
And if I hit enter that is 6 characters in.
Now I'm gonna use a function in a minute called, called, right? Okay, so I'm gonna start on the right now, let zoom in massively.
Okay, so if I use the, the right function, imagine the end of this string.
If I use the right function, I wanna calculate one charact, I wanna capture one character, two characters, three characters, 4, 5, 6, 7, 8.
Okay? So I wanna capture eight characters from the right to capture that 29,000.
Now, the way I'm gonna do that, and I need to make a slight amendment to that find function, but I'm gonna do that, I'm gonna double back and do that is if I go to the cell below, we can use another function called Len, so equals Len and Excel says Len returns the number of characters in a string, okay? So it'll figure out how many characters are in this string and then, what we're gonna do is we're gonna kind of use that to figure out how many characters to the right were gonna count.
And I already know that. Now, if you think what you talking about, let's actually put this into practice.
So Len, I'm gonna hit tab to insert the bracket and I'm gonna go and grab that cell, nice and simple.
Excel says, Hey Jonathan, there are 15 characters in that cell.
Great. So what I want you to do Excel is I want you to start on the right and I want you to start on the right and want you to kind of count backwards.
Now we'll do the right function in a minute, but, but to figure out the number of cells to count backwards.
If we know there are 15 cells, 15 characters in that cell, and a slash appears in character, at character six.
If I said equals 15 minus 6, ah no, that's not right.
Okay? So Excel is saying if you start on the right, I can count, I can count back nine characters.
So what it would do is it would, it would count, count back one.
So you start the 0, 1, 2, 3, 4, 5, 6, 7, 8, 9.
So it's gonna, if we, if we use the formula as it's using the right function, it's gonna try and grab that space at the beginning.
And I don't want it to do that.
So don't actually want it to find a that slash character.
I want it to find that character and count one character forward, okay? One character forward. So what, I'm gonna do a very slight amendment here, but I wanna kind of go through the logic of this with you. So you know what I'm doing that six, I'm gonna add one to it.
Whoops, I'm gonna add one to it. So this is really simple.
When I add one to it, the difference between the two is gonna change to eight, and that means that I can now use my right function.
So I'm gonna say equals R-I-G-H-T returns a specified number of characters.
In fact, guys, we're gonna use 8 from the end of a string.
So let's say tab Excel says in its syntax, it says, Hey Jonathan, what's the text? Well, that's the text I want you to look at.
So go look at C6, comma, and Excel will say, I'm gonna start at the end, how many characters you want me? Count, count from the end, well, I guess eight and fantastic.
It returns 29,000. Exactly what I wanted it to do.
Now what what I'd like to do is maybe just kind of bring this together.
So what, what we could do in the demand in the model, we could just say, okay, equals go and grab that 25, 20,000, 29,000 and we're all good, okay? We've done it, but it's a bit untidy to have it sitting as different characters.
So, um, let's kind of pull it together.
Now, if I go to my cell E11, which is where I'm looking at the difference between those, the, the length of the cell and the position of that slash character, I'm just gonna nest, I'll do this in stages.
I'm gonna nest the fine function in there.
So if I press F2, you can see it's feeding off of E5.
So rather than it feed off of E5, why don't I grab E5? I'm actually gonna wrap it in a bracket, okay, gonna just kind of bundle it all together.
But why don't I grab E5, which I've wrapped in a bracket and I'm gonna copy it.
You'll notice that I haven't selected the equal sign, so I haven't selected that, but I'm gonna copy E5 and I'm gonna go back to that cell where I'm calculating the difference, the reference to E5 control V, I'm gonna paste in that fine function and that means that now I've nested that together, I can entirely dispose of that fine function in its own right because I've nested it in.
I could do the same with looking at that different cell, it's giving me an eight, it's feeding off of E6.
So rather than feed off of E6, I can go to E6.
I can go and grab and copy control C to copy, or you can right click on it and copy if you prefer, I can go and grab that Len function back to the difference and where it references E6, I can over the top of that paste in the land function, which means that we just get rid of that now, right? Okay, so we're just tidying things up.
Now, if you look at the right function, the right function feeds off of E7, but rather than reference E7 rather than reference E7, I can grab it not including the equals sign control C to copy it back down and just paste in place of the reference to E7 place that that formula.
So now what we've done is we've just nested the whole thing together, which is much tidier.
Maybe it's more difficult to just code that out in one stream, breaking it out logically into small steps.
You know, it's a much tidier thing to do.
What I'm actually gonna do, I want this in a different place.
I'm gonna grab the contents, I'm gonna copy it, I'm just gonna paste it v paste it in the correct place, okay? And we've got this, I'm gonna do the same for the unit costs.
Now, the unit costs thankfully just in the interest of us only having nine minutes left on the call the, getting extracting unit costs is actually quite a bit easier.
So I'm just gonna go to a random cell, I'll break this into, into some stages and then we'll nest them together at the end.
Okay? So I'm gonna go into just a couple of random cells here and to try and extract the the cost, I'm gonna do the same thing.
I'm gonna say equals F-I-N-D, we're going to use the find function.
I'm gonna go to Excel, I'm gonna go to cell C6.
And what we're gonna look for is that slash again, so I'm gonna say equals find open bracket slash close quote comma, Excel says, okay, I'm looking for a slash, but where, what cell am I looking for that within? So I'm gonna go back to C6 and it's a position six, but we knew that already, right? So we knew it was at number six.
Now I'm gonna use another function called left. Okay? So for the left function, I wanna grab the cost, right? Which is one character, two characters, three characters, four characters. It's four characters. It's not five characters and it's not six characters.
I don't wanna use the left function to grab the first six characters because that would include the space and the slash.
So I wanna dismiss the slash as a character count and the space there.
So in fact, what I'm gonna do in my fine function is I'm gonna minus two from that.
So we're gonna use the left function, but we're gonna count four characters in.
So let's do that equals LEFT left returns, a specified number of characters.
In fact, we're gonna use four from the start of the string.
So let's say tab Excel says, well where's the text? Well, it's C6, right? Comma, how many characters do you want? Well, I want four, okay? And it's gonna return 0.45 or 45 cents. Sounds great.
Now again, what I could do is I could just grab that and pull that into my model, but in the interests of us having seven minutes left and making things a little bit neater what I'm gonna do is just nest this together so you can see that the left function feeds off of E9.
So why don't I go and grab the contents of E9, not including the equals sign copy and paste that into the reference to E9.
Okay? That means I can do away with E9.
Now I can go and grab that entire formula and just copy and paste it into my model, okay? And actually it's really straightforward now.
So now we've extracted those two, can we calculate the revenue? Can we calculate the variable cost? Can we calculate the profit? Of course we can.
The revenue is the product of the price and the demand.
Really just a really simple model, right? The variable cost is the product of the unit cost and the demand.
So the profit would be equal to the revenue minus the variable cost minus the fixed cost.
Okay? That gives me the profit.
Nothing weird going on there.
And if I zoom out in the bit, we're just gonna go into standard data tape mode now.
So left of the model and just pull the profit into that.
I'm gonna select the entire data table.
Now we wanna use a shortcut, probably you don't have to, but we probably wanna use a shortcut for a data.
Initiate the data table, the shortcut is alt A for data.
W for what if T for data table. Okay? So if I'd selected the entire model alt as we have above A for data.
So you can see that that's bringing up the data ribbon here.
W so if you look here, it says what if analysis, I'm gonna hit W and then T for data table. So I'm not using my mouse to click on anything, I'm using shortcuts.
And then Excel says, great, Jonathan, you've got a data table.
I can see what you're trying to show.
Because on the top left you, you've got a link to the profit for your model.
So you're trying to spray that across the entire data table.
I can see that we've got a, I can see we've got a row of headings here.
Now I could take for example, 0.55 slash 29,000.
I could say 0.5 slash 29,000.
I could take 0.45 slash 30,000. I can swap those out.
Where do you want me to put these numbers? You know, so why don't you chuck them in C12? So if you took something like 0.4 slash 30,000, chucked it in there, my formula having done a bit of formula work would rip out the unit cost and the demand and then the model would be able to calculate from that the profit number.
And that means we can in that row of headings, we can actually sensitize on two different things because the formula's smart enough to pull 'em apart.
You could do more than two, right? So in that cell you could do three and it would mean mean that you'd need, you know, to use exactly the same approach, but you need to use some more formula work.
Maybe separate them with different characters.
So look for different characters or you can use the mid function to find something in the middle anyway row input cell sensitize, that cell column input cell excel's got load of prices here.
So let's sensitize it on the price and if we click okay, then across the entire table it will show all the different profits.
Let's just test this.
So if we had say a price of $4, let's grab my pencil.
If we had a price of $4 and if we had unit cost of 45 cents in demand of 29,000, the table thinks that we'd have profit of 57,950.
I tend to agree because in the model we've got a price of $4, we've got 45 cents cost, 29,000 demand.
And that is what the model is showing me.
So we know it works. Guys, we have three minutes left, so I think that's probably the end of the example.
If anyone's got any questions, please feel free to ask.
Um, for the short amount of time we've got left, I'll just pause only momentarily we'll avoid any uncomfortable silences.
So imagine you guys are okay.
All that remains to be said there is thanks so much for taking the time to dial in. It's really nice to have you guys on the call.
I really appreciate that this is being recorded so you can rewatch it if you want to.
And, files are available to download in the link that was provided with the, have a fantastic day guys. Thanks.